As we wrote in earlier articles one of the biggest problems of transition from education to work is the significant share of young people, who are no longer in education or training, but they also do not have a paid job. So-called NEETs are usually counted in the population aged 15-24.
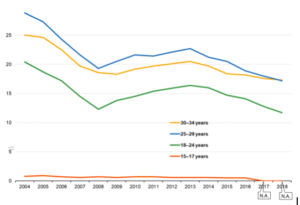
In Poland such age range may be misleading due to the national legislation, which impose schooling obligation on youth till the age of 15, and education obligation till the age of 18 (either at school, or at the employers’). This means that there is no official data on teenagers. Even if in Labour Force Survey some teenagers aged 15-17 could be identified as dropouts, they cannot be officially coded as NEETs, because they are formally registered as pupils in schools or trainees in other type of institutions, even though they do not attend in practice. Consequently, in the database of LFS results on the NEETs rate by age, Eurostat shows no data in the age group 15-17. And while before 2017 there was some percentage of NEET reported in this age group (0.5-0.9%), such data was marked with “low reliability” mark.
However, data for age groups 18-24 and 25-29 are reliable and show the dynamics in youth chances on the market. Over time there can be three different stages of NEET rate fluctuation defined. The 3 phases reflect:
1) integration with the EU, emigration and economic recovery process (2004-2008),
2) economic crisis (2009-2013),
3) economic recovery and implementation of the youth focused policies (2013-now).
It is to be noted that in the last 5 years the NEET rate in Poland decreased significantly. In 2018, the NEET category amounted to 11.7% among youth aged 18-24 and 17.2% among youth aged 25-29 (Table 1).
Table 1. Young people neither in employment nor in education and training, by age, PL, 2004–2018, (%)
| Age \ Year | 2004 | 2005 | 2006 | 2007 | 2008 | 2009 | 2010 | 2011 | 2012 | 2013 | 2014 | 2015 | 2016 | 2017 | 2018 |
| 15–17 yo | 0.8 | 0.9 | 0.7 | 0.6 | 0.7 | 0.6 | 0.7 | 0.7 | 0.6 | 0.6 | 0.6 | 0.5 | 0.5 | NA | NA |
| 18–24 yo | 20.4 | 18.7 | 17.2 | 14.5 | 12.3 | 13.8 | 14.5 | 15.4 | 15.9 | 16.4 | 16.0 | 14.7 | 14.1 | 12.8 | 11.7 |
| 25–29 yo | 28.8 | 27.3 | 24.3 | 21.6 | 19.3 | 20.5 | 21.6 | 21.4 | 22.1 | 22.7 | 21.2 | 20.5 | 18.9 | 18.0 | 17.2 |
Source: Eurostat (online data code: edat_lfse_20)
Figure 1. Young people neither in employment nor in education and training, by age, Poland, 2004–2018 (%)

Based on: Eurostat (online data code: edat_lfse_20)
Written by Fundacja Rozwoju Demokracji Lokalnej


